(1/5/16)
Macroeconomics vs. Microeconomics
- Large - Small
- The study of the - The study of
individual or specific units of the economy.
economy as a whole. - Supply & demand
- Inflation - Market
Structures
- Wage Laws - Business Organizations
- International Trade
Positive Economics vs. Normative Economics
- Attempt to describe - Attempt to prescribe how
the world should be.
the world as is. - "Ought to
be" & "Should be"
- Very descriptive in - (opinion based)
nature.
- "What is" (collects
&
presents facts)
- Reliable/factual
- (fact based)
Needs vs. Wants
- Basic requirements - Desires of citizens
for survival.
1) Food
2) Water
3) Shelter
4) Clothing
Goods vs. Services
- Tangible (touchable) - Work that is preformed
for someone else.
commodities. - Ex./ hair
salon, concerts, education etc.
1) Capital Goods: Items
used in the creation of
other goods, such as
machinery & trucks.
2) Consumer Goods:
Goods that are intended
for final use by consumer.
Scarcity vs. Shortage
- Most fundamental - Quantity demanded
greater than quantity supplied
problem that all - (Demand
> Supply)
societies face.
- Trying to satisfy unlimited
wants w/ limited needs.
Ex./ Oil (most scarce resource)
(1/6/16)
Factors of Production: resources required to produce goods and services.
1. Land - natural resources
2. Labor - work force
3. Capital - Physical capital
(tools, machinery, robots, factories, trucks)
Human capital (skills,
talent, knowledge acquired through education or experience)
4. Entrepreneurship - innovative;
risk taker
Trade-offs:
Alternatives that we give up
whenever we choose one course of action over another.
Opportunity Cost:
The next best alternative. (Form
of trade-offs)
Production Possibilities Curve (PPC) / Frontier
(PPF)/ Graph (PPG) : Shows alternative ways on how to use a country's
resources.
4 assumptions of the PPG (graph):
1. Two Goods: resources are used
to produce one or both of only two goods.
2. Fixed Resources: land, labor,
capital, and entrepreneurship.
3. Fixed Technology: the
information and knowledge that society has about the production of goods and
services is fixed.
4. Full Employment of Resources:
using resources effectively.
A -On the curve
-Attainable & efficient
- More refrigerators are being produced
than cars
B -On the curve
-Attainable & efficient
C -On the curve
-Attainable & efficient
-More cars are being produced than
refrigerators
X -Inside the curve
-Attainable BUT inefficient
-Underutilization
Y -Outside the curve
-Unattainable
-Currently not producing
Underutilization- using fewer
resources than the economy is capable of using.
Efficiency- using resources in such a way to maximize the production of goods and services.
Allocative Efficiency- the
products being produced are the ones that are the most desired by society.
Productive Efficiency- products are being
produced in the least costly way and this would represent any point on the
PPC.
3 types of movement that occur within the PPC:
1. Inside the PPC: occurs when
resources are unemployed or underemployed.
2. Along the PPC
3. Shifts of the PPC: When a
point moves from on the curve to outside the curve, the graph
increases. If it moves from on the curve to inside, the graph decreases.
increases. If it moves from on the curve to inside, the graph decreases.
(1/7/16)
What causes the PPC/PPF to shift? (6 causes)
1. Advances in technology
2. Change in Resources
3. Change in the Labor Force
4. Economic Growth
5. Natural Disasters/War/Famine
6. More education/training (human
capital)
Inside the curve -
underutilization-->attainable, but inefficient
On the curve - attainable and efficient
Outside the curve - unattainable
with the current resources
(1/11/6)
DEMAND
Demand is the quantities that
people are willing and able to buy at various prices.
The Law of Demand: there is an
inverse relationship between price and quantity demanded.
What causes a "change in
quantity demanded"? (ΔQD) Δ in price

What causes a "change in demand"? (ΔD)
1) Δ in buyers taste
(advertisement)
2) Δ in the # of buyers
(population)
3) Δ in income (-normal
goods -inferior goods)
4) Δ in the price of related
goods (-complementary goods -substitute
goods)
5) Δ in expectations
Normal goods: increase in income causes an increase in demand.
Inferior goods: increase in
income causes a fall in demand.
Complimentary goods: ex./ fries
w/ ketchup
Substitute goods: ex./Coke
replaced by Pepsi
(1/12/16)
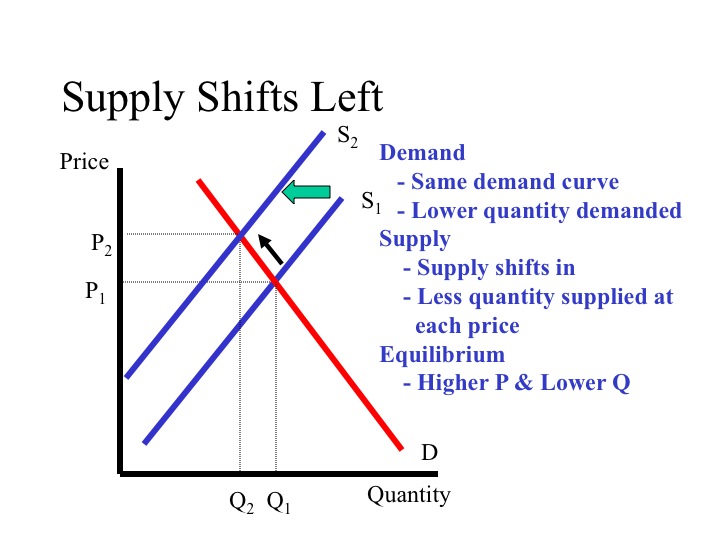
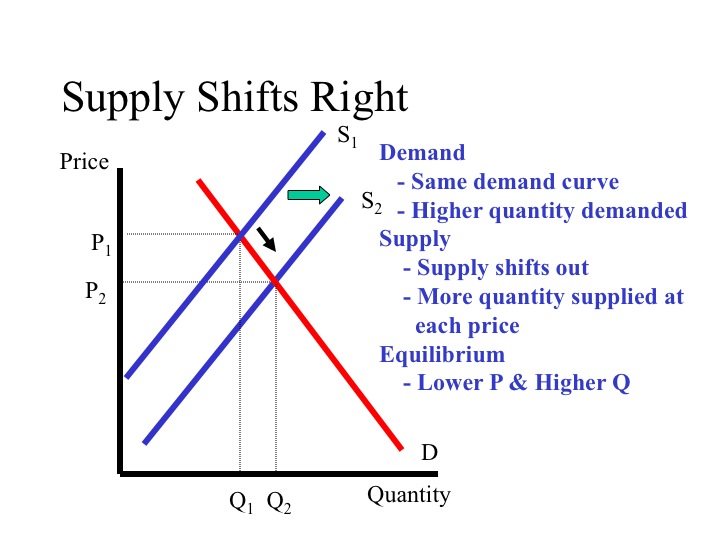
SUPPLY
Supply is the quantities that
producers or sellers are willing and able to produce at various places.
The law of Supply: there is a
direct relationship between price and quantity supplied.
What causes a "change in
quantity supplied"? (ΔQS) Δ in price.

What causes a "change in supply"? (ΔS)
1) Δ in technology
2) Δ in weather
3) Δ in the costs of production
4) Δ in the # of sellers
5) Δ in taxes or subsidies
6) Δ in expectations
(1/13/16)
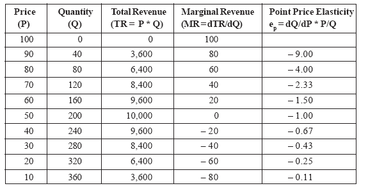
ELASTICITY OF DEMAND
- A measure of how consumers react to a change in price.
- A measure of how consumers react to a change in price.
1) Elastic Demand: Demand that is
very SENSITIVE to a change in price. E>1
-Product NOT a
necessity
-Available
substitutes
2) Inelastic Demand: Demand that
is NOT very SENSITIVE to a change in price. E<1
-Product IS
necessity
-FEW or NO
substitutes
-People
will buy no matter what
3) Unitary Elastic: E=1
Ex./
Elastic Demand |
Inelastic Demand
- Soda -Gas
- Steaks -Insulin/medicine
- Candy -Milk
- Fur Coats -Salt
-Toothpaste

*Price Elasticity of Demand: 3 Step Formula
1)Quantity (New Q - Old Q/ Old Q)
2)Price (New P - Old P/ Old P)
3)PED (% Δ in Q demanded/ % Δ in
price)
TOTAL REVENUE- The total amount
of $ that a firm receives from selling goods & services.
TR = P x Q
- Fixed Cost: A cost that does not change no matter how much is produced.
ex./ rent, mortgage,
insurance, salaries
- Variable Cost: A cost that
rises or falls depending upon how much is produced.
ex./ electricity
(based upon usage)
- Marginal Cost: The cost of
producing 1 more unit of a good.
(1/15/16)
Formulas:
TFC + TVC = TC
TFC + TVC = TC
AFC + AVC = ATC
TFC/Q = AFC
TVC/Q = AVC
TC/Q = ATC
TFC = AFC x Q
TVC= AVC x Q
(1/17/16)
Equilibrium is the point at which the supply curve and the demand curve intersect. At this point, all resources are being efficiently used.
Excess demand occurs when the quantity demanded is greater than the quantity supplied. This will result in shortages, where consumers cannot get the quantities of items that they desire.
Price ceiling creates a shortage. A price ceiling occurs when the government puts a legal limit on how high the price of a product can be. In order for a price ceiling to be effective, it must be set below equilibrium. For example, the government sets a price ceiling on flu shots and shots are sold for less than what they are worth; therefore creating a shortage of flu shots.
Ex: Rent control (New York &
San Francisco)
Excess supply occurs when the quantity supplied is greater than he quantity demanded. This will result in a surplus, where producers have inventories they cannot get rid of.
Price floor is the lowest legal price a commodity can be sold at. A price floor creates a surplus. Price floors are used by the government to prevent prices from being too low. The most common price floor is the minimum wage.

(1/21/16)
BUSINESS CYCLE
Peak: The highest point of real
GDP
- This phase exhibits the lowest
unemployment & the greatest amount of spending.
- Inflation becomes a problem.
Expansion (Recovery): Where real
GDP in increasing due to an increase in spending &
a decrease
in unemployment.
Contraction/Recession: Where real
GDP is declining for 6 months due to a reduction in
spending
& an increase in unemployment.
Trough: The lowest point of real
GDP & exhibits the highest amount of unemployment

